
Chemical risks: anticipating a leak before it happens
A gas leak at an industrial site gives no warning. Osprean lets the municipality simulate how it would behave: which way the cloud would travel, how far it would spread and what it would mean for the population. It also classifies the industries in the municipality by their nature, so they can be kept under control and risks prevented.
Other emergencies
How Osprean responds
Two tools to understand and control chemical risk
Industry classification
- Catalogues the municipality's industries by their nature: activity, substances handled and hazard level.
- Keeps a geo-referenced, up-to-date inventory so they are better controlled.
- Helps prioritise monitoring and planning for the sites that could affect the municipality most.
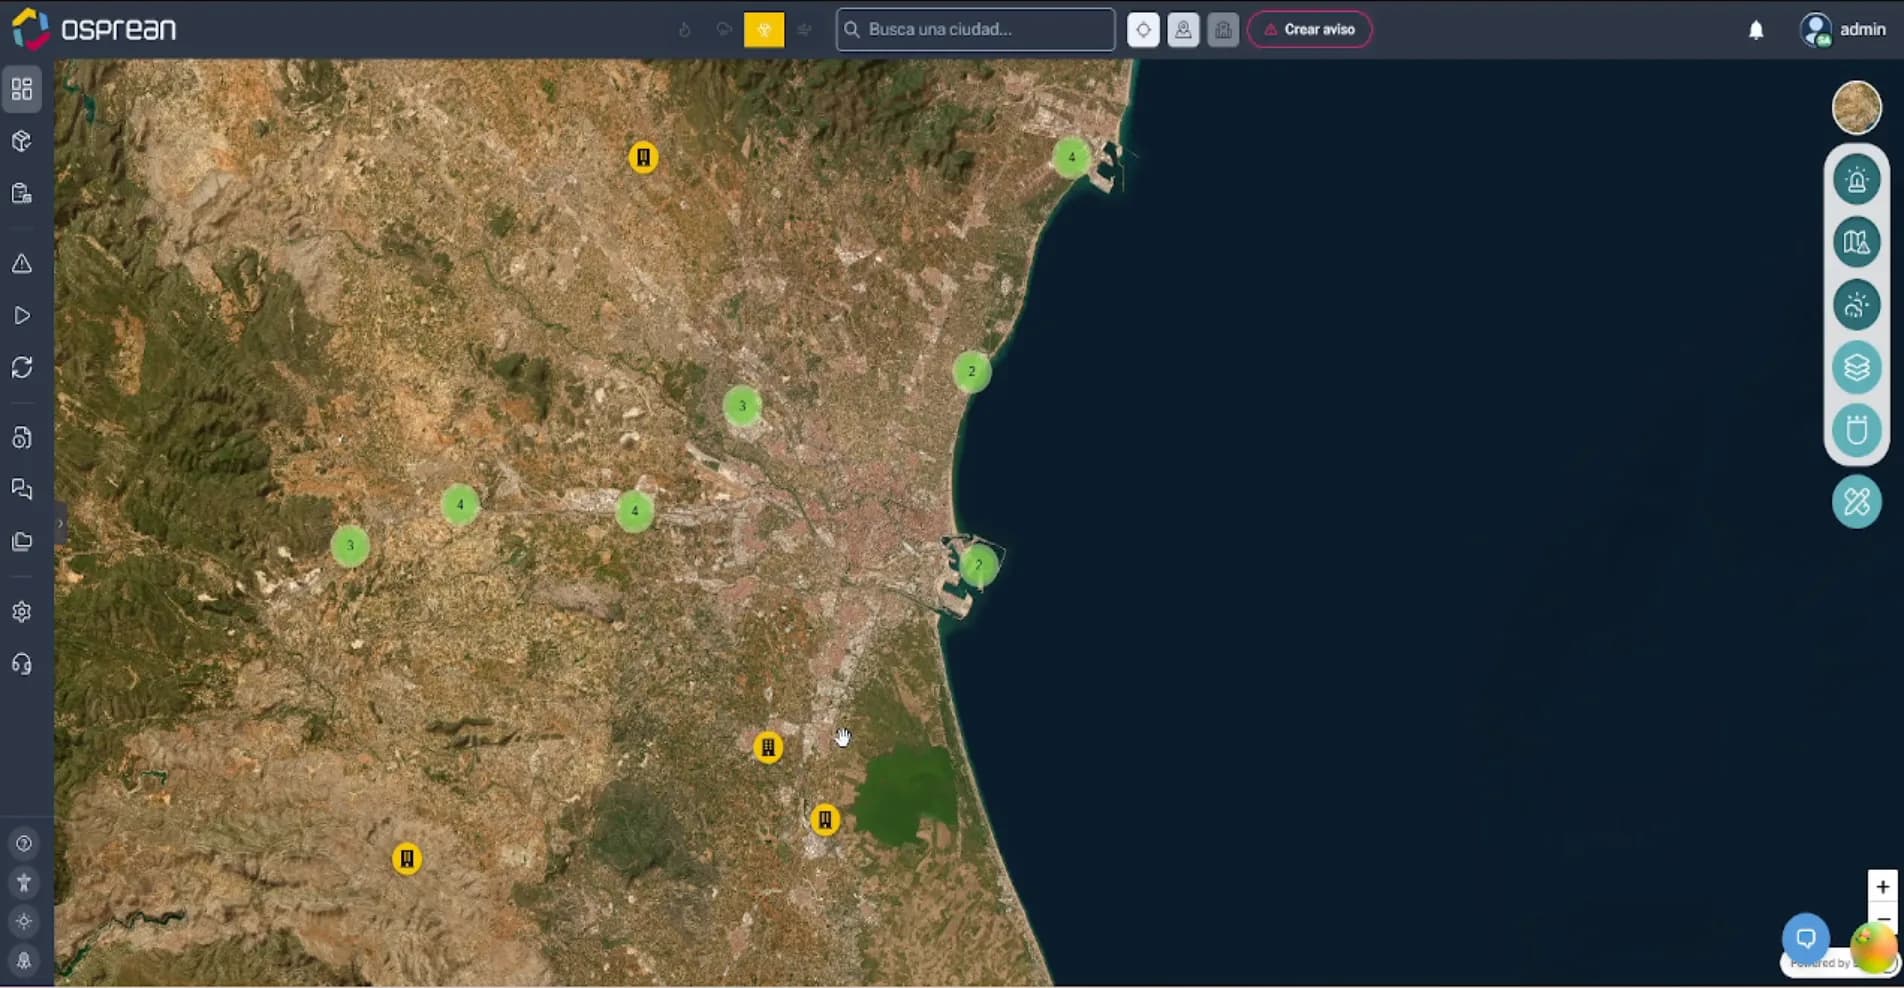
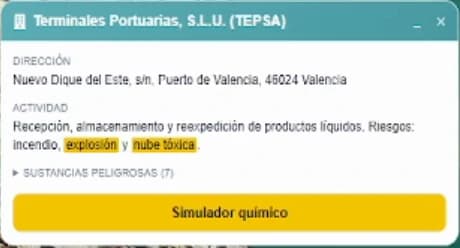
Gas leak simulation
- Recreates the gas release from its point of origin and shows on the map which way the cloud would move.
- Calculates the extent of the cloud and the areas that would fall within its reach.
- Estimates the level of impact on residents in each area, so the decision on where to shelter in place and where to evacuate is made in time.
Reference case
Explosion at the Tarragona petrochemical complex, January 2020
On 14 January 2020, shortly before 18:45, an ethylene oxide reactor exploded at the IQOXE plant in La Canonja. The reactor lid was hurled into a residential building in the Torreforta neighbourhood. Civil Protection first asked seven municipalities to shelter in place and later narrowed the order to La Canonja and Vila-seca. The sirens never sounded and many residents found out through social media; the Catalan government's subsequent report identified shortcomings in communication with the public. This is how Osprean would have responded to a scenario like this.
- Deaths
- 3
- Distance reached by the reactor lid
- ≈2.5 km
- Municipalities in the initial shelter-in-place alert
- 7
- Duration of the shelter-in-place order
- ≈3 h
Data published by the Government of Catalonia, the Public Prosecutor's Office and the media. Illustrative deployment scenario.
How Osprean would have responded
- 1
Before the accident
Classified site and prepared scenarios
The plant is listed in the municipal inventory with its activity, the substances it stores and its fire, explosion and toxic-cloud risks. Leak scenarios have already been simulated and built into the emergency plan.
- 2
First minutes
Leak simulation with real weather data
From the site record, the chemical simulator runs with the current wind: which way the cloud would travel, how far it would spread and which neighbourhoods would fall within its reach.
- 3
First hour
Zone-based public alerts
The shelter-in-place order reaches only the areas that need it, with a clear message on the public page and in the alerts, instead of confining seven municipalities as a precaution or leaving residents without information.
- 4
Following hours
Monitoring, lifting the order and damage
The simulation is updated as conditions change, the order is lifted zone by zone, and damage to homes, such as in Torreforta, is recorded with its location for the recovery phase.
Frequently asked questions
What does a gas leak simulation show?
The direction the cloud would travel, how far it would spread and the level of impact on the population in each area. With that information, the municipality can decide in advance where to shelter in place, where to evacuate and which resources to mobilise.
Why classify the industries in the municipality?
To know which sites exist, what activity and substances they handle and what level of risk they pose. This keeps them better controlled and lets the municipality prioritise prevention on those that could most affect its residents.
Are there high-risk industries in your municipality?
We will show you how to simulate a leak in your area and how to classify the sites worth monitoring.